Fibonacci levels (Fibonacci)
Fibonacci levels (Fibonacci) - technical analysis tool, market indicator. Often these levels act as support or resistance on the price chart. Fibo levels are based on the Fibonacci mathematical series, in which each subsequent value is equal to the sum of two previous values (0, 1, 1, 2, 3, 5...).

How to set Fibonacci levels?
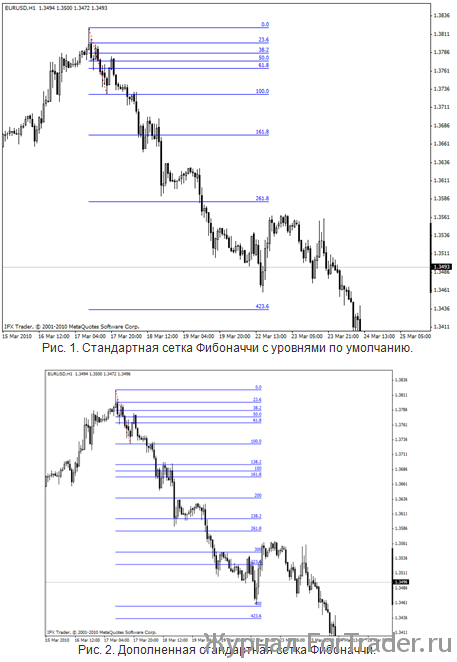
In order to properly install Fibonacci levels on the chart, it is necessary to determine the minimum and maximum of the analyzed period. The minimum will take the value 0%, and the local maximum will correspond to 100%. Between the maximum and minimum we set the key levels of 23.6%, 28.2%, 50%, 61.8% and 76.4%. Thus, we get a Fibonacci grid on the price chart.
How to use Fibonacci levels?
Thanks to Fibonacci levels it is possible to determine with a high degree of probability the target of price correction when a level is broken. Based on Fibonacci levels, it is possible to determine the probable targets of trend continuation. Such input values as 161.8% and 261.8% are used. It should be noted that the 0% and 100% levels will act as strong support and resistance lines.